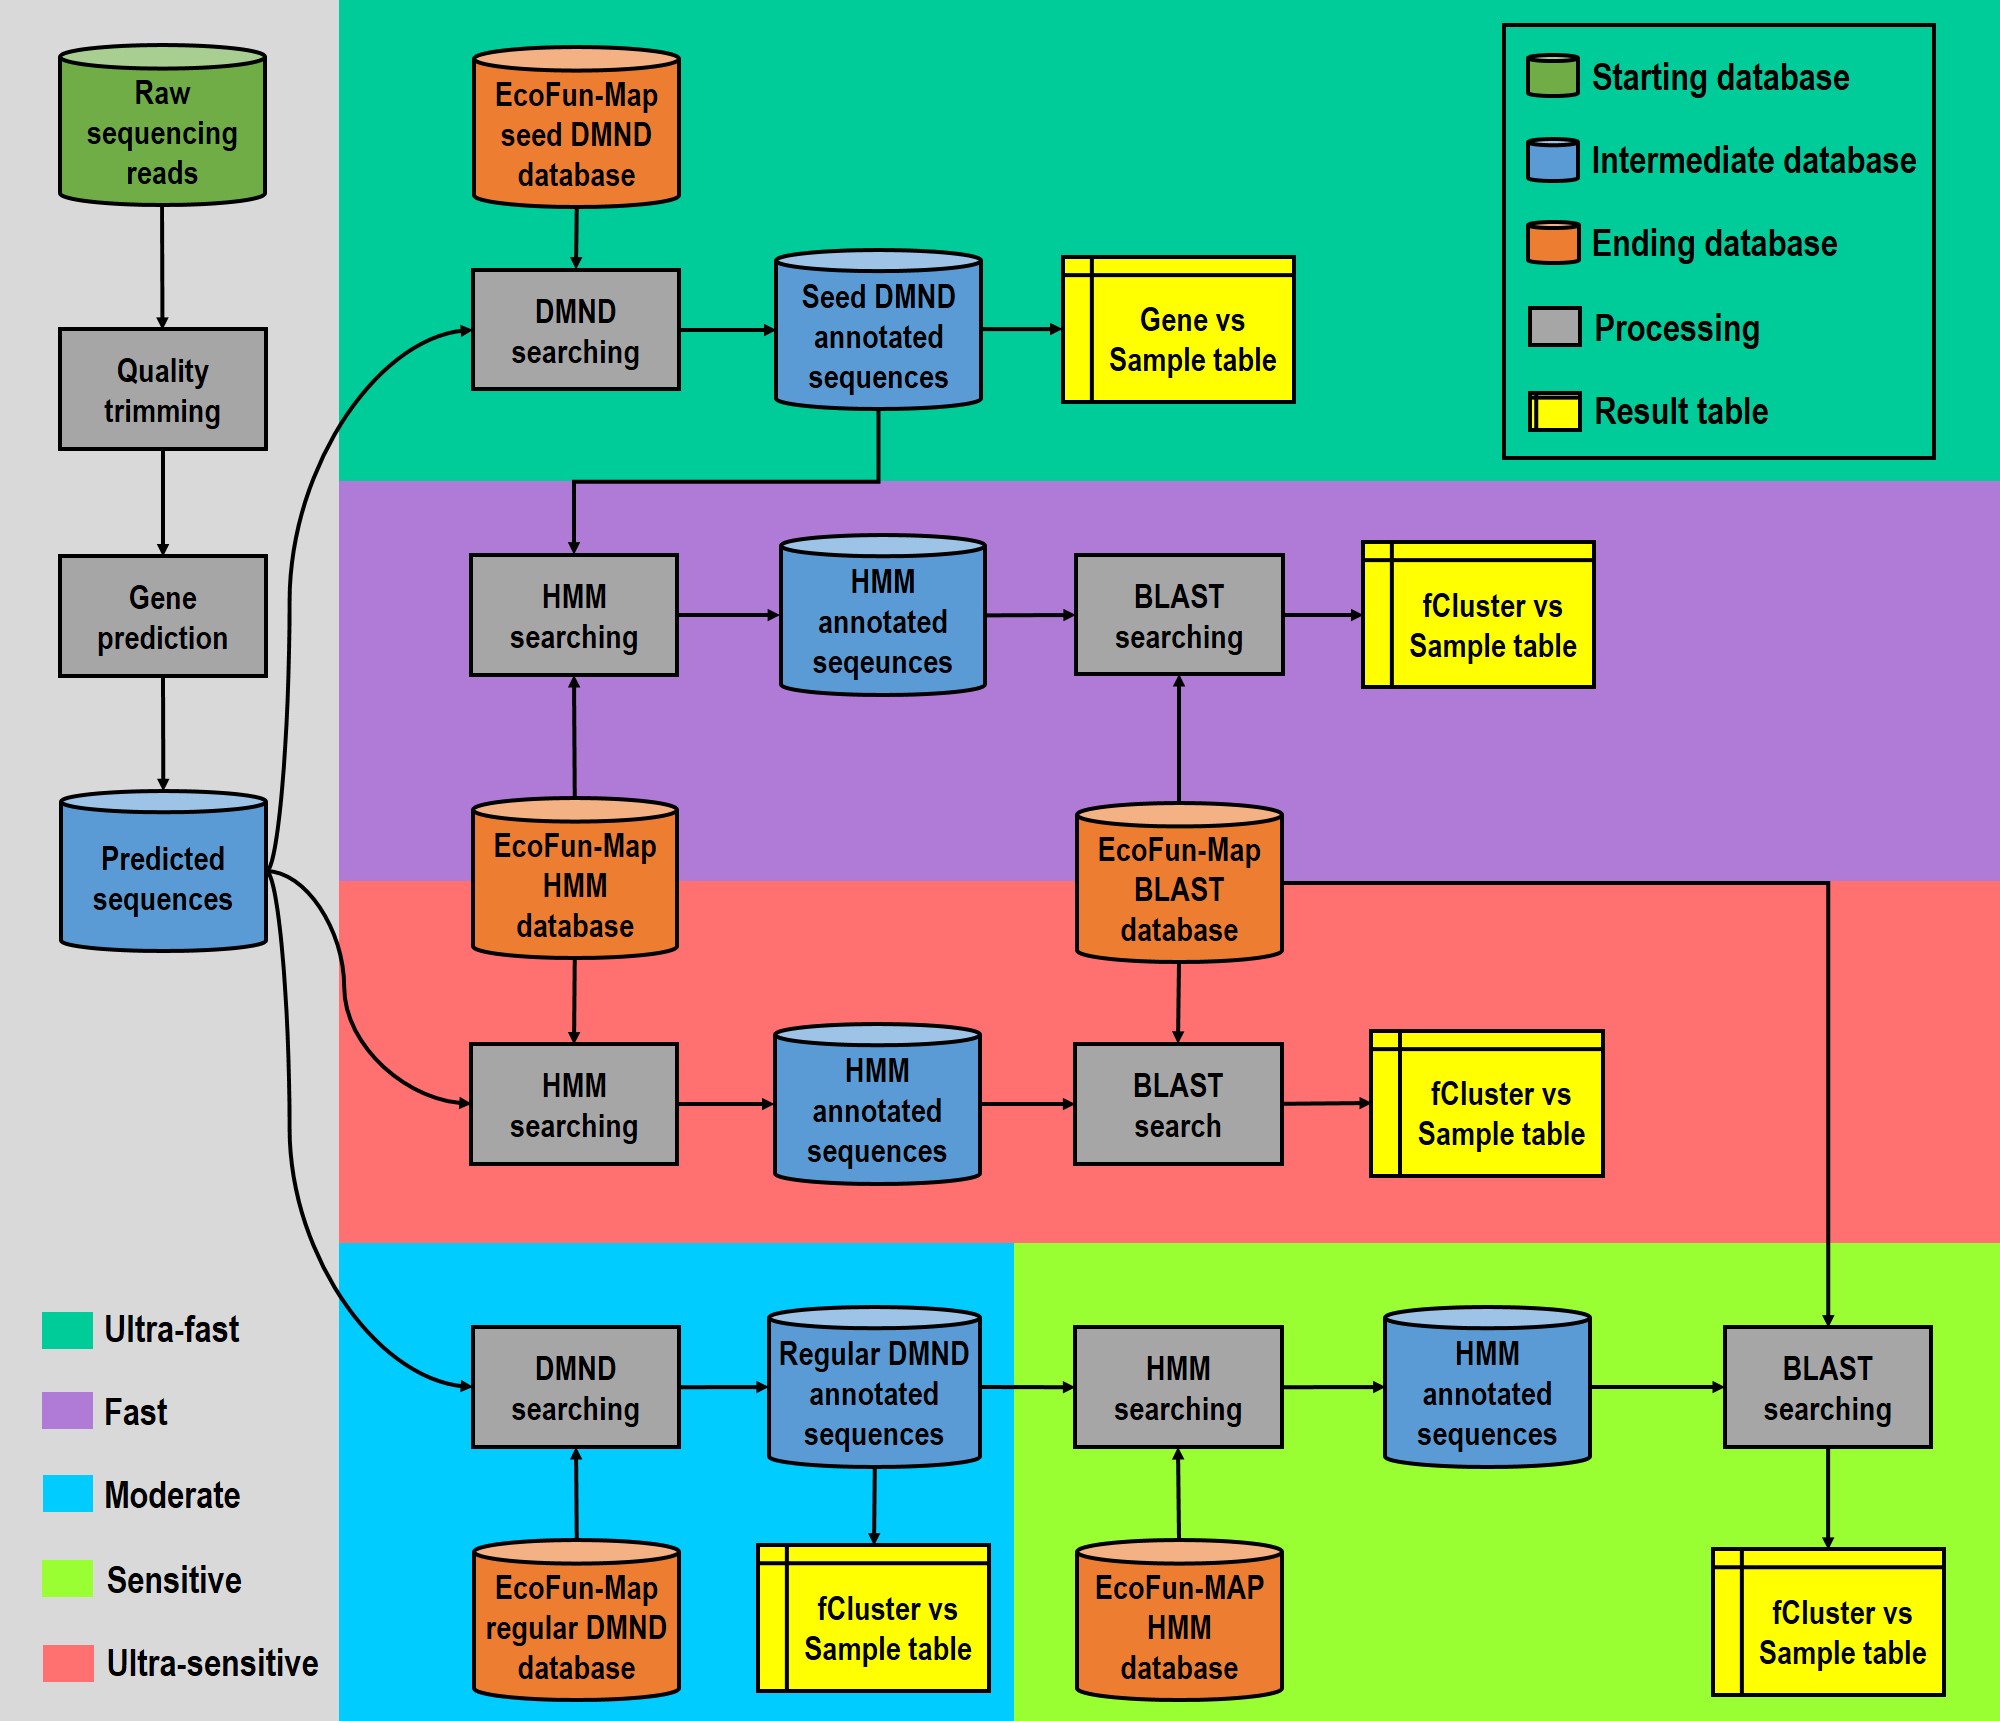
The flowchart of five workflows in the EcoFun-MAP, which include
mode of Ultra-fast (green background), Fast (purple background),
Moderate (cyan background), Sensitive (yellowgreen background), and
Ultra-sensitive (red background). The preprocessing steps are on
the grey ground. Cylinders represent starting (green), intermediate
(blue) and ending (orange) databases. Grey rectangles represent
processing steps in construction, which take content of databases
or output of immediate upstream processing steps as input for
processing. Shapes of yellow documents represent resulting
matrix-like table.

